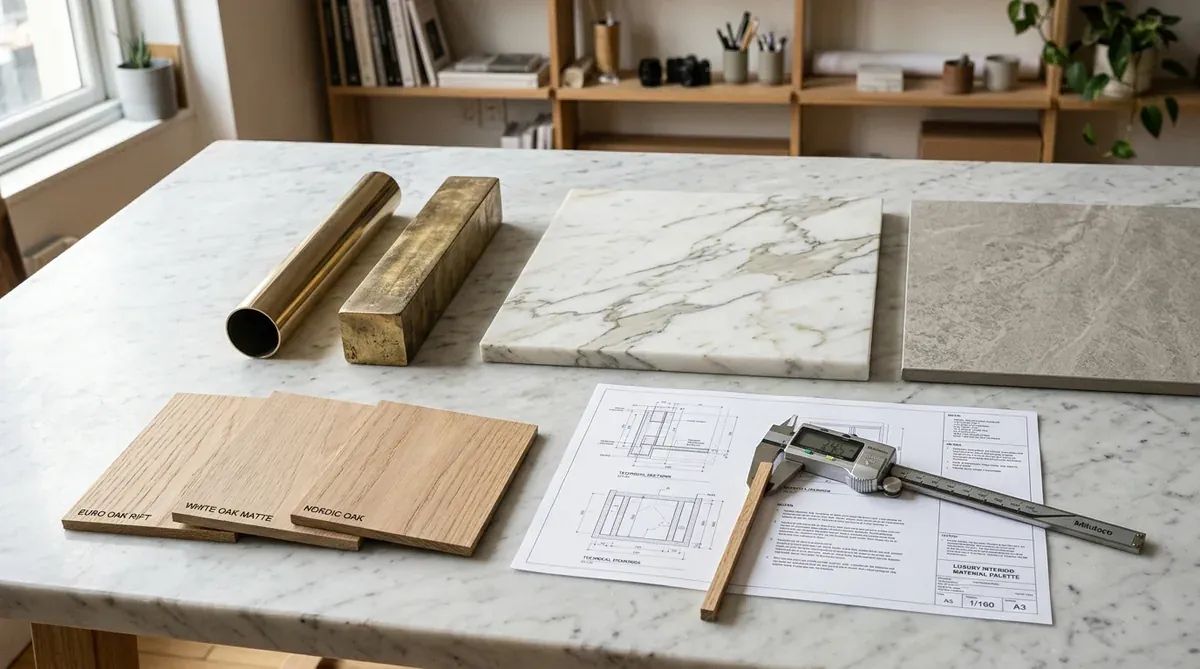
Four bids come back and every one sits above budget; the lowest is 18% over. Priced against 300 keys, the solid brass hardware, the 20mm Italian marble tops and the full solid-timber carcasses open a CapEx gap in the tens of millions NTD, not something a few points of discount will close. The two usual responses each cost something: an across-the-board 20% cut, which takes the specified surface finish with it, or accepting the overrun and pushing the pressure into the operating years. What is actually available to move is the layer the drawings never specify and the budget feels most, which is the substrate.
Confronted with budget deficits, developers often face a destructive dilemma: blunt price chopping that compromises build quality, or accepting overruns that distort project financial models.
A third route works the component list line by line, through a Value Engineering (VE) Cost Optimization Matrix. Authentic VE is never “cheapening materials or diluting specifications”; it holds the specified surface luster, tactile quality, and 10-year structural life while changing what sits underneath, with material science, composite cores, and precision machining bringing the component cost down, capturing in net CapEx savings.
1. Value Engineering Cost Rationalization Mathematical Model & 3 Inviolable Red Lines
The mathematical return of Value Engineering is modeled as:
+-------------------------------------------------------------------------+
|                  3 Inviolable Red Lines of Value Engineering (VE)       |
+-------------------------------------------------------------------------+
|  ┌───────────────────────────────────────────────────────────────────┐  |
|  │ 1. Zero Structural Fatigue Compromise: 100% BIFMA 80k-cycle pass  │  |
|  ├───────────────────────────────────────────────────────────────────┤  |
|  │ 2. Zero Life Safety Compromise: BS 7176 Crib 5 & JIS F☆☆☆☆ VOC pass│ |
|  ├───────────────────────────────────────────────────────────────────┤  |
|  │ 3. Zero Aesthetic Compromise: 1:1 Preservation of specified luster │  |
|  └───────────────────────────────────────────────────────────────────┘  |
+-------------------------------------------------------------------------+
2. 4 Critical Casegoods Components: VE Material Substitution Matrix
4 Critical Joinery Elements: VE Material Science Optimization Matrix
| Component Category | Original High-CapEx Spec | Sunder Optimized VE Spec |
|---|---|---|
| 1. Metal Detailing | Solid Cast Brass | 304 Stainless + PVD TiN |
| 2. Stone Tops | 20mm Italian Natural Marble | 6mm Sintered Stone + AL |
| 3. Timber Carcass | 100% Solid Hardwood | Birch Multi-Ply + Veneer |
| 4. Long-Span Bases | Oversized Timber Beams | Q235B Steel Box Subframe |
3. Deep-Dive Material Science Engineering Substitutions
+-------------------------------------------------------------------------+
|     Microstructural Interfaces: 4 Core VE Material Science Solutions    |
+-------------------------------------------------------------------------+
|  【1. Metal: PVD Vacuum Ion Coating (HV 2000 Hardness / 40% CapEx Save)】|
|   ┌─────────────────────────────────────────────────────────────────┐   |
|   │ 1.5 µm Titanium Nitride (TiN) PVD nanocoating (Scratch-proof)   │   |
|   ├─────────────────────────────────────────────────────────────────┤   |
|   │ 304 Austenitic stainless substrate (Tensile >= 520 MPa, 0 Rust) │   |
|   └─────────────────────────────────────────────────────────────────┘   |
|                                                                         |
|  【2. Stone: 6mm Sintered Stone + Aluminum Honeycomb (35% CapEx Save)】 |
|   ┌─────────────────────────────────────────────────────────────────┐   |
|   │ 6.0 mm High-density sintered stone (Mohs 7 hardness, 0.02% abs) │   |
|   ├─────────────────────────────────────────────────────────────────┤   |
|   │ 12.0 mm Aerospace aluminum honeycomb (60% lighter, +400% impact)│   |
|   └─────────────────────────────────────────────────────────────────┘   |
+-------------------------------------------------------------------------+
1. 304 Stainless Steel PVD Ion Plating vs. Solid Brass (40% CapEx Savings)
- Solid brass is dense (elevating freight CBM costs), soft and prone to denting, and oxidizes to a dull black finish within months under subtropical humidity.
- Sunder deploys 304 stainless steel with PVD titanium nitride (TiN) ion plating, achieving a Vickers hardness of (5x harder than brass) and passing ASTM B117 96-hour salt spray tests at of brass cost.
2. 6mm Sintered Stone Composite vs. 20mm Natural Marble (35% CapEx Savings)
- Natural marble is porous, absorbing wine, coffee, and acidic cleansers into permanent deep stains.
- Sunder integrates 6mm Italian sintered stone laminated over a 12mm aluminum honeycomb core. Water absorption drops to , Mohs hardness reaches Level 7, and structural weight decreases by , which lowers edge loading during crane handling and site carry.
3. Multi-Ply Birch Core + 0.6mm Veneer vs. Solid Timber (30% CapEx Savings)
- Solid timber splits and warps under continuous indoor air conditioning.
- Sunder utilizes JIS F☆☆☆☆ birch multi-ply cores cold-pressed with architectural white oak veneer and PUR edge fusion, reducing seasonal movement while preserving authentic timber warmth.
4. Concealed Q235B Steel Box Subframes vs. Heavy Timber Beams (25% Savings)
- For 2.4m cantilevered media consoles and desks, internal wall-thickness Q235B structural steel box sections restrict long-term creep deflection strictly to , expanding flexural capacity by .
4. Actuarial Quantification: 300-Key Hotel VE Matrix 10-Year Financial Model
The figures below are a modelled scenario, not measured results: 300 keys, an original FF&E budget of NTD 120M (NTD 400k per key), a 10-year hold, and maintenance costs left undiscounted. Change the key count or the per-key budget and the absolute savings move proportionally; the percentages hold roughly steady.
300-Key Hotel VE Cost Optimization & 10-Year TCO Actuary
| Actuarial Parameter | Original Unoptimized Spec | Sunder VE Spec |
|---|---|---|
| FF&E CapEx per Key | NT$ 400,000 / Room | NT$ 310,000 / Rm |
| Total 300-Key Initial CapEx | NT$ 120,000,000 | NT$ 93,000,000 |
| Direct Upfront CapEx Saved | Baseline | NT$ 27,000,000 |
| 5-Year Marble Stain & Brass Rpr | NT$ 6,800,000 | NT$ 0 (Sintered) |
| 5-Year Timber Split Remediation | NT$ 5,400,000 | NT$ 0 (Multi-ply |
| 10-Year Cumulative OpEx Drain | NT$ 18,000,000 | NT$ 5,400,000 |
| 10-Year Cumulative TCO Outlay | NT$ 138,000,000 | NT$ 98,400,000 |
| 10-Year Net Wealth Created | Baseline Sunk Loss | +NT$ 39,600,000 |
Under those assumptions the upfront CapEx gap is NTD 27,000,000, a 22.5% reduction, and the 10-year maintenance gap is roughly NTD 12,600,000, for a combined NTD 39,600,000. Both are model outputs rather than measurements, and the second figure moves substantially if the maintenance assumptions change.
5. Total Cost of Ownership (TCO): Unoptimized Spec vs. Sunder VE Matrix
10-Year TCO Evaluation: Original Unoptimized Spec vs. Sunder VE Matrix
| Evaluation Vector | Original Unoptimized Spec | Sunder VE Matrix |
|---|---|---|
| Upfront CapEx Load | Severe budget overrun | 15% ~ 25% Reduction |
| Material Durability | Prone to splits and stains | Mohs 7 / 0% Staining |
| Maintenance Burden | Heavy (Polishing/Waxing) | Zero-maintenance |
| Aesthetic Realization | 100% (High Luxury) | 100% (High Luxury) |
| 10-Year Cumulative TCO | Baseline (100% + Repairs) | Reduced to 28% |
6. Conclusion: Engineering Win-Win Value through Material Science
In institutional hospitality and luxury property development, superior procurement does not surrender design vision, nor does it capitulate to budget overruns; it deploys modern material science and precision fabrication to transform extravagant conceptual drawings into constructible, resilient, high-yield balance-sheet assets.
Sunder establishes rigorous B2B Value Engineering matrices aligned with German industrial standards. By providing 1:1 physical verification during the Mock-up Room phase, an owner can handle both options before the purchase order is signed. VE has limits worth stating: on low-value, low-quantity components the tooling and sampling cost can exceed the saving, and where a contract names a designer-specified brand, substitution requires written agreement from the owner and the design team. A fabricator cannot make that call alone.