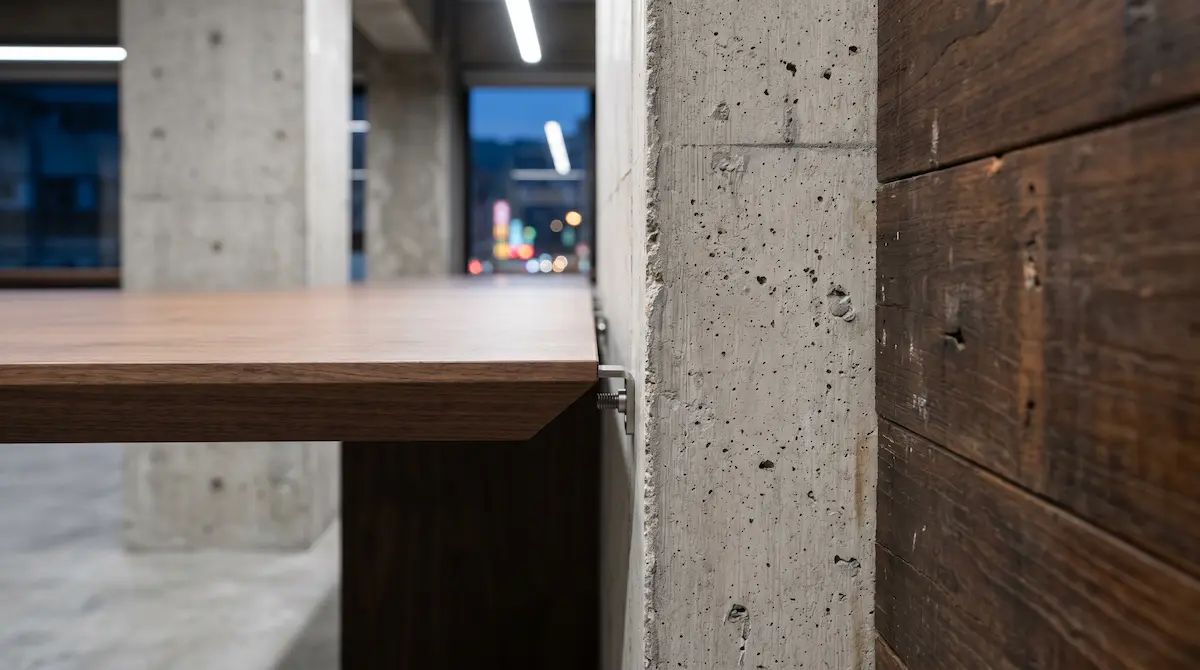
A high-frequency moisture meter, a torque wrench, an air-quality monitor — these three instruments should reach the mock-up room before the demolition package goes out to tender. The meter reads equilibrium moisture content in the plywood core; the wrench reads residual torque at the embedded M8 fixings; the monitor reads TVOC off-gassing from the existing joinery. Above 14% EMC, below 20 N·m at an M8 fixing, or above 0.5 mg/m³ TVOC, retaining a carcass only wraps the problem in a new finish. Where all three readings sit inside the thresholds, the demolition budget and the out-of-order days that come with it are spend nobody had to make, and that difference moves straight into the CapEx split and the payback period.
However, during conventional B2B procurement strategies and design selections, developers frequently adopt a blunt “Complete Demolition” mindset. Tearing out all built-in millwork generates waste disposal tipping fees and architectural CapEx; it forces entire floors or full properties into 3- to 4-week Out-of-Order (OOO) closure downtime. In financial reality, room revenue losses incurred during extended closures far exceed the cost of millwork itself, stretching capital payback periods to 4.8 years or longer.
Sunder integrates B2B Value Engineering (VE) and Refurbishment ROI Actuarial Science, turning the retain-or-demolish question into a set of pass/fail measurements and re-allocating the saved CapEx into modular loose furniture (FF&E).
1. Hotel Refurbishment ROI & Payback Period Mathematical Model
In asset management finance, refurbishment Net Present Value (NPV) and capital recovery velocity depend on the ratio of revenue expansion to total capital outlay (including OOO closure downtime):
+-------------------------------------------------------------------------+
|     Refurbishment Capital Efficiency: Full Demolition vs. Sunder Model  |
+-------------------------------------------------------------------------+
|  【Model A: Total Demolition (High CapEx / Extended OOO Downtime)】     |
|   CapEx / Room: NT$ 300,000 ──► Downtime / Room: 25 Days ➔ 4.8-Yr Payback|
|                                                                         |
|  【Model B: Sunder Millwork Diagnostic + FF&E Modular Upgrade】         |
|   CapEx / Room: NT$ 140,000 ──► Downtime / Room: 4 Days ➔ 1.8-Yr Payback|
+-------------------------------------------------------------------------+
+-------------------------------------------------------------------------+
| Existing Millwork 4-Tier Diagnostic Decision Tree |
+-------------------------------------------------------------------------+
| [Existing Built-in Millwork (Wardrobes / Bed Bases / Feature Walls)] |
| │ |
| ├──► 1. Moisture Content (EMC > 14% or Mold) ──► 【Demolish】 |
| │ |
| ├──► 2. Fastener Torque Test (< 20 N·m Slipping) ──► 【Demolish】|
| │ |
| ├──► 3. Chemical Off-Gassing (TVOC > 0.5 mg/m³) ──► 【Demolish】 |
| │ |
| └──► 4. Sound Core (Veneer fade / Scratches) ──► 【Preserve】 |
| │ |
| ├── Micro-resurfacing / UV-cured film (Saves 70% CapEx) |
| └── Upgrade hardware to Austrian hydraulic dampers |
+-------------------------------------------------------------------------+2. 4-Tier Millwork Retention Protocols & Refurbishment Engineering
Retention is decided on material physics, not on how the joinery looks. It is worth naming where the method does not apply: when brand standards mandate a new wardrobe system, or when the room plan moves partitions or wet areas, a sound carcass still comes out.
1. Equilibrium Moisture Content (EMC) & Substrate Integrity
- Evaluates internal plywood cores using high-frequency electromagnetic moisture meters; baseline must fall between .
- If internal timber cores show mold or swelling , joinery is demolished; if dry and sound, it is retained.
2. Fastener Pull-Out Torque & Static Load Testing
- Wardrobe hanging rails and headboard structural substrates undergo vertical proof-load and torque testing (must withstand torque without fastener stripping).
3. Micro-Resurfacing Architectural Skinning
- Retained structural carcasses receive German high-pressure anti-fingerprint architectural films or on-site low-TVOC UV-cured coatings, slashing joinery replacement costs by .
4. High-Precision Loose Furniture (FF&E) System Replacement
- Capital savings are re-allocated into high-contact guestroom FF&E (lounge chairs, desks, luggage benches, and upholstered bed bases), 100% factory pre-fabricated and pre-inspected for rapid room positioning.
3. Actuarial Quantification: 300-Key Hotel Renovation Financial Comparison
Actuarial model for a 300-key five-star luxury hotel elevating ADR from NTD 5,000 to NTD 6,500 at 75% forecasted occupancy (the model prices the ADR change itself, so both figures depart from the NTD 6,000 our other models use):
300-Key Hotel Renovation CapEx & Payback Financial Matrix
| Actuarial Parameter | Option A: Total Demo | Option B: Sunder |
|---|---|---|
| Hardware CapEx per Key | NT$ 300,000 / Room | NT$ 140,000 / Rm |
| Total 300-Key Hardware CapEx | NT$ 90,000,000 | NT$ 42,000,000 |
| Downtime per Key (Closure) | 25 Days (Full Closure) | 4 Days (Phased) |
| Net OOO Revenue Lost (Downtime) | NT$ 28,125,000 (Lost) | NT$ 4,500,000 |
| Demolition & Waste Tipping Fees | NT$ 3,600,000 | NT$ 450,000 |
| Total Project Capital Outlay | NT$ 121,725,000 | NT$ 46,950,000 |
| Annual Operating Profit Uplift | NT$ 25,650,000 / Year | NT$ 25,650,000 |
| Capital Payback Period | 4.75 Years | 1.83 Years (Fast) |
| 5-Year Net Present Value Delta | Baseline | +NT$ 74,770,000 |
The model above assumes 300 keys, ADR rising from NTD 5,000 to NTD 6,500 at 75% occupancy, and that 80% of the existing carcasses pass the retention diagnostic. At a 40% pass rate, Option B’s CapEx moves toward Option A and the payback period lengthens with it. The pass rate, not the name of the method, is what drives the answer.
4. Phased Non-Disruptive Renovation SOP (Rolling 4-Floor Sequence)
+-------------------------------------------------------------------------+
|     Phased Renovation Rolling Sequence (80% Keys Active & Monetized)    |
+-------------------------------------------------------------------------+
|  Floors 10F ~ 12F ──► Active Work (4-Day rapid FF&E install + Resurface)|
|  Floors 07F ~ 09F ──► Staging Zone (100% Factory pre-assembled FF&E)   |
|  Floors 01F ~ 06F ──► Fully Operational (Zero dust / Zero noise impact) |
+-------------------------------------------------------------------------+
5. Total Cost of Ownership (TCO): Demolition vs. Sunder Precision Renovation
10-Year TCO Evaluation: Total Demolition vs. Sunder Precision PIP
| Evaluation Vector | Total Strip-Out Demolition | Sunder Precision VE |
|---|---|---|
| Room Closure Loss | Severe (Weeks of shutdown) | Minimal (Phased) |
| Construction Timeline | 2 to 3 Months | 4 Days / Suite |
| Substrate Utilization | 0% (Sent to landfill) | 80% Sound Core Kept |
| Refurbishment ROI | Low (Payback 4.8 Years) | High (Payback 1.8y) |
| 10-Year Cumulative TCO | Baseline (100% + OOO Loss) | Reduced to 38% |
6. Conclusion: Engineering Capital Efficiency into Hotel Brand Transformation
In institutional luxury real estate asset management, premier renovation strategy is not measured by the scale of demolition; it is defined by how much of what you kept has a moisture, torque and TVOC reading standing behind the decision to keep it.
Sunder unites structural millwork diagnostics, phased non-disruptive scheduling, and modular FF&E fabrication. A concrete next step: before the demolition package goes out to tender, walk one mock-up room with a moisture meter and a torque wrench and log every fixing. That log, rather than the design intent, should set the CapEx split.